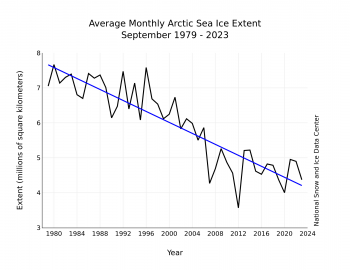
I’ve published this graph before. It shows the level of Arctic Sea Ice Extent for every September of the satellite era. September is the month when SIE bottoms out, and starts accumulating again as fall sets in. As I usually point out, the trend continues to drop, year after year; there is noise in the data for sure, but the overall trend is down.
This year the SIE is the 4th lowest on record except for 2007, 2012 and 2020. Prior to 2012, the overall lowest Arctic SIE of the satellite era, the low ice record was broken on the average of about once every 6 years. Although the overall trend is still plummeting alarmingly, its now been 11 years since the record was broken. Is there any significance to this, or is it just an anomaly, an outlier, a fluke? Granted, a one year extreme deviation (or lack thereof) is not particularly significant. SIE is not only a function of average Arctic temperature, it is also sensitive to local wind and current conditions. If the ice clumps up, or is dispersed too much, the SIE can drop or raise even if the total amount of ice cover is essentially unchanged. Its the way SIE is defined (area of ocean with at least 15% sea ice). In fact, SIE is used as a metric because it is resistant to erratic changes, it yields smoother curves in the long run.
Still, it may be significant that the September SIE minimum has now gone 11 years without breaking the 2012 record. That’s twice as long as it has gone before without doing that. Is this possibly good news, or am I reading to much into this? What do you guys think?