• Space/Science
  • GeekSpeak
  • Mysteries of
    the Multiverse
  • Science Fiction
  • The Comestible Zone
  • Off-Topic
  • Community
  • Flame
  • CurrentEvents

Recent posts

GUYS!!! THE ZONE IS LIVE!!!!!! RobVG September 7, 2026 11:47 pm (CurrentEvents)

Thomas Friedman NYT - Trump Put His Own Interests Above All in the Iran Deal BuckGalaxy June 19, 2026 11:42 am (Flame)

Mars Mirage podrock June 18, 2026 4:37 pm (Space/Science)

Trump's "Total Victory" in Iran BuckGalaxy June 17, 2026 12:53 am (CurrentEvents)

The old king--Bob Dylan at 80. ER June 14, 2026 4:19 pm (Off-Topic)

Rant about anti-Israel hate BuckGalaxy June 13, 2026 2:45 pm (Flame)

I saw "Disclosure Day" today. ER June 12, 2026 8:00 pm (Science Fiction)

50 sites BuckGalaxy June 10, 2026 9:19 pm (Off-Topic)

1700 free online university courses BuckGalaxy June 10, 2026 8:58 pm (Off-Topic)

Sigh. podrock June 10, 2026 12:29 pm (CurrentEvents)

Home » Space/Science

MASIE dots August 26, 2018 6:15 pm ER

http://eh2r.blogspot.com/2018/08/slow-bye-bye-of-east-siberian-ice.html

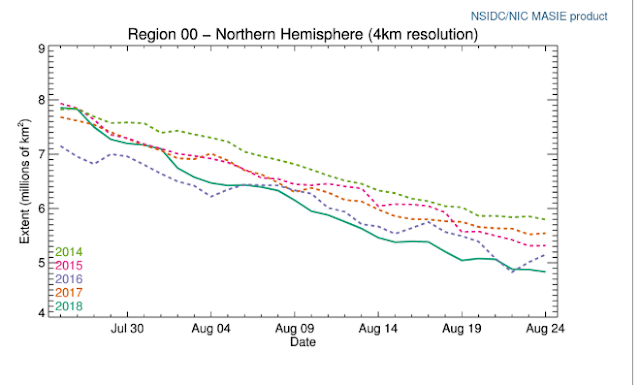
If we resample Arctic ice data 25 km^2 pixels down to a higher 4 km^2 resolution the ice extent looks somewhat different. This processing requires some assumptions, some modeling and some blending in of additional data, so I prefer not to use it, but it does give us some additional insights. The difference in maps compiled from these two data sets gives us some idea of how badly the ice has been chopped up by this year’s frequent cyclones.

Compare this MASIE high res data for August
.

with the low-res raw data for the same time period in the Charctic interactive graph

https://nsidc.org/arcticseaicenews/charctic-interactive-sea-ice-graph/

and you get different rankings for different years, as well as lower sea ice extents all around. The latter is probably just an artifact of the processing, but as I like to point out, its not the absolute figures that count, its the trends.

    Search

    The Control Panel

    • Log in
    • Register