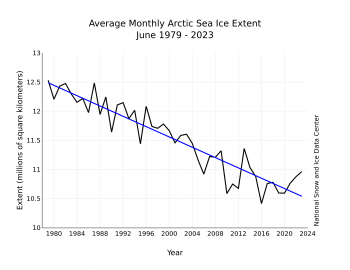
The downward linear trend in Arctic sea ice extent in June over the 45-year satellite record is 44,300 square kilometers (17,100 square miles) per year, or 3.8 percent per decade relative to the 1981 to 2010 average (Figure 3). Based on the linear trend, since 1979, June has lost 1.99 million square kilometers (768,000 square miles) of ice. This is roughly equivalent to the size of Mexico.
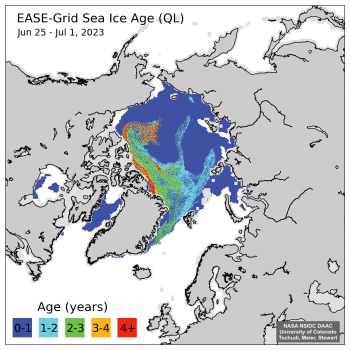
An update of sea ice age reveals extensive areas of first-year ice extending far north from the Siberian coast. While first-year ice is generally thinner and more prone to melt completely than older ice, the extensive first year ice located in high northern latitudes may not melt out completely. An area of multiyear ice, much of it 4+-years old residing in the Beaufort Sea region, will likely survive the summer melt season.
I suggest you visit the nsidc.org page and examine these graphics in hi-res. While you’re there, take advantage of the interactive graph and and study the development of these trends over time: There’s a reason why I harp on this web-page. It is the most dramatic and persuasive demostration of global warming I can recommend.
https://nsidc.org/arcticseaicenews/charctic-interactive-sea-ice-graph/
And while you’re at it, show the trends for this years ANTarctic sea ice extent. This year’s southern ice maximum looks like its shaping up to be catastrophically low. It appears global warming has finally made it to the Southern Ocean.