Note: X (time) axes of these graphs are not identical
http://www.esrl.noaa.gov/gmd/webdata/ccgg/trends/co2_data_mlo.png

http://www.esrl.noaa.gov/gmd/webdata/ccgg/trends/co2_trend_mlo.png

Note: The yearly oscillation in CO2 levels is attributed to the N hemisphere growing season
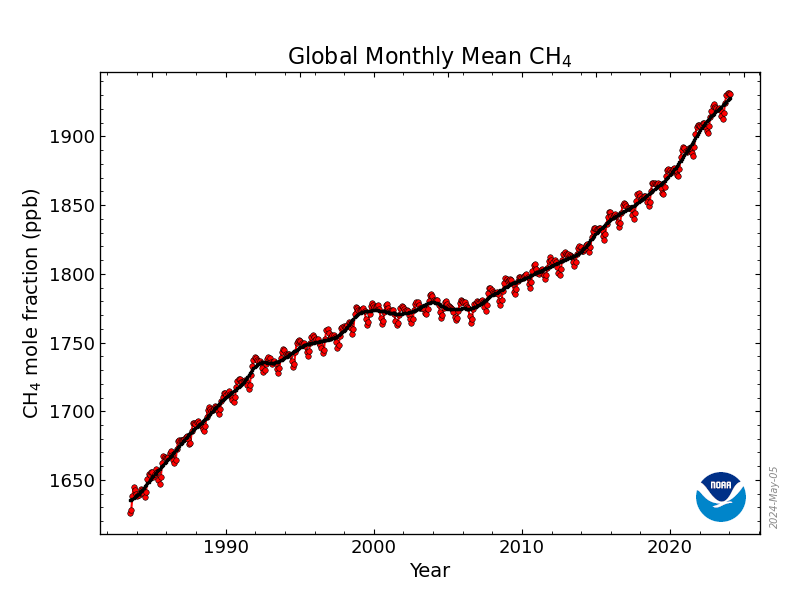
http://www.esrl.noaa.gov/gmd/webdata/ccgg/trends/ch4_trend_all_gl.png
http://www.esrl.noaa.gov/gmd/webdata/ccgg/trends/ch4_trend_gl.png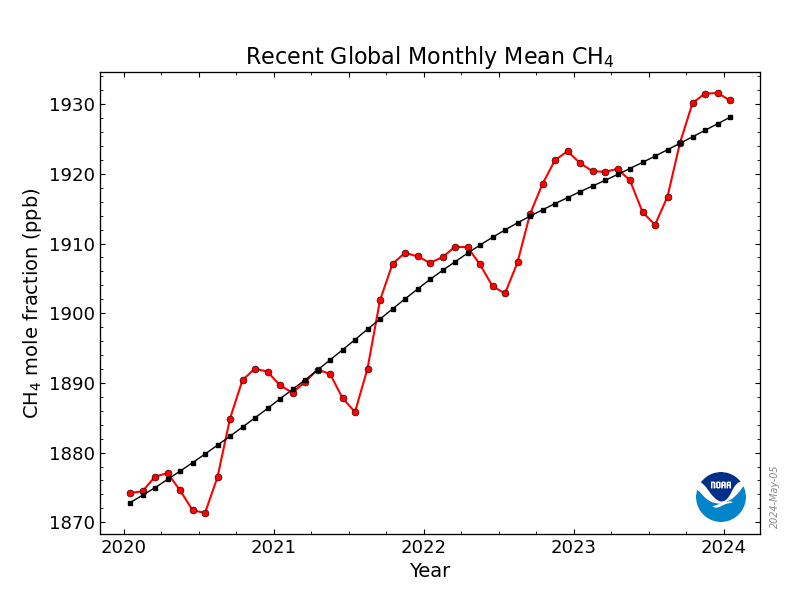
https://www.ncdc.noaa.gov/monitoring-content/sotc/global/2014/ann/timeseries/land-ocean-combined.png
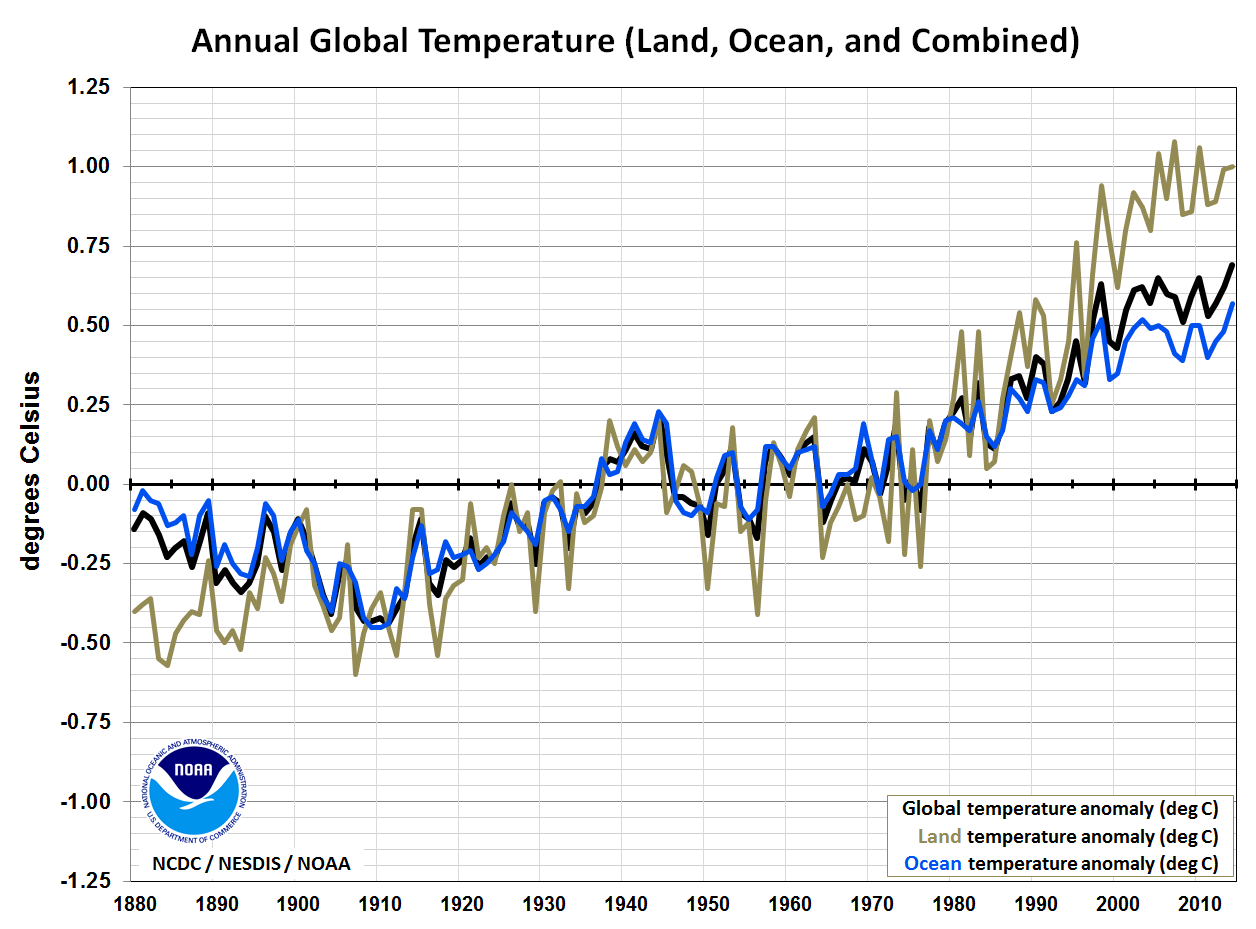
Of course, correlation does not necessarily imply causation. There! Feel better now?